drawanimated
Matplotlib - Draw Animated with Staged Incremental Blitting
Tue Nov 28 08:20:24 AM PST 2023
Matplotlib supports blitting to make animated plots update faster. But there are limitations to the default approach.
If your chart has fixed axis limits and you only animate the actual data the default implementation works well. Most data elements (Line2D, etc) are reasonably fast to render.
If you chart needs to have dynamic axis limits you then need to animate the appropriate X and/or Y Axis and performance drops significantly. Rendering the ticks and labels is by comparison very expensive.
This project shows how to use two approaches to improving animations. There are two types of chart artists: static and dynamic. The static data only needs to be redrawn when changed, the dynamic data is updated continuously.
- Static data typically would include the X/Y axes, spines, legends and titles.
- Dynamic data updates frequently, this would normally be the lines and plots.
The second problem with Matplotlib is the latency of drawing complex plots. If the time used for drawing exceeds about 100ms that stalls the GUI event processing and makes the use of the surrounding program difficult as interactions with the GUI are slow or delayed.
This projects uses a staged approach to rendering by limiting the time spent drawing to about 10ms before allowing the GUI to process events.
Incremental Drawing
The typical approach to animation using Matplotlib is to defined all of the artists required setting some of them to be animated.
Then:
- draw the non-animated artists
- save the drawing
- loop
- restore the drawing
- draw the animated artists
- blit the result
If you have expensive artists that are need be animated (e.g. ticks, labels, legends, annotations) this can result in slow frame rates. If some of the expensive artists only need to be redrawn periodically (e.g. x/y limit change) then not rendering them continuously is a win.
Then:
- draw the non-animated artists
- save the base drawing
- loop
- restore the base drawing
- draw the static animated artists
- save the static background
- loop until reset
- draw the dynamic artists
- blit the result
For simple line or scatter plots animation of the X/Y axis ticks and labels etc can amount to 70-80% of the drawing time. Only doing the remaining 20-30% can improve FPS dramatically.
Staged Drawing
Complex plots with many dozens of static and dynamic artists can take a long time to draw. If done without a break the surrounding GUI will become unresponsive.
This library implements a simple state machine that allows each of the operations (drawing, blitting, etc) to be done separately. Allowing the caller to arrange for the GUI to run and process its events.
elapsed = 0
while True:
    t1 = perf_count()
    name, type, next = drawanimated.draw(flushevents=True)
    if name is None:
        break
    elapsed += perf_count() - t1
    if elapsed < 0.01
        continue
Sample Code
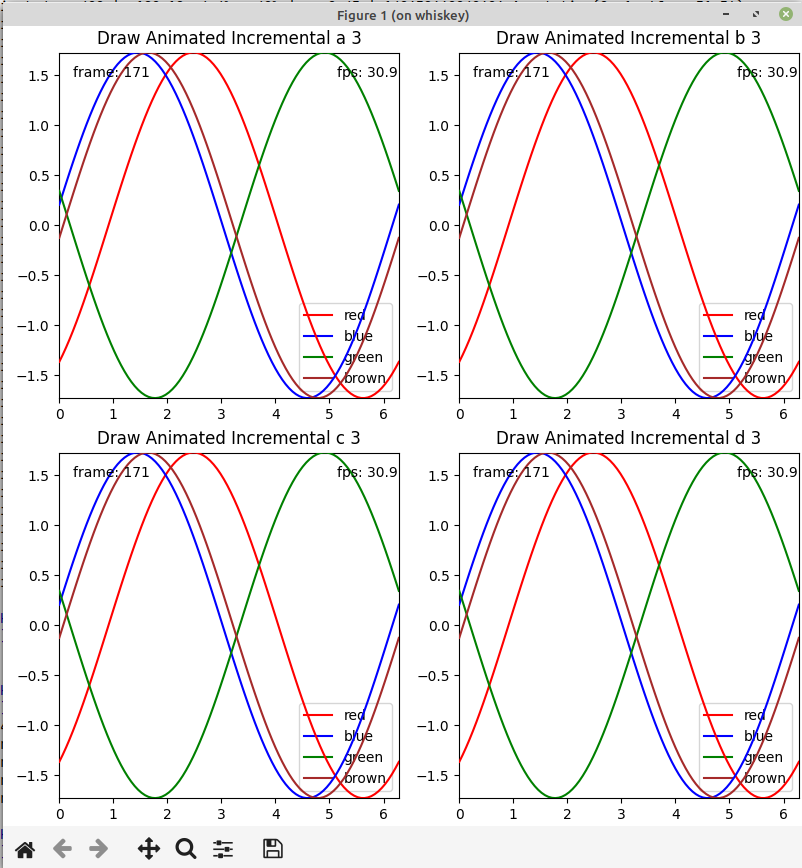
The sample code included animates a 2x2 mosaic plot each containing four lines and two text annotations and a title. The ylimits are periodically changed so that the YAxis ticks and labels need to be redrawn (i.e. they need to be animiated not static.)
With the default approach the plot updates at less than 10fps. With the incremental approach we can see about 30fps (Linux).
Sample Times
The sample program dumps the average time and number of times for rendering each child axes in the figure, sorted by the average time for rendering.
We can see that the most expensive artists are the XAxis, YAxis and Legends. These range from 6 to 10 milliseconds for drawing. But the number of times these are drawn is much less than the dynamic data.
By comparison all of the dynamic artists are about 1 millisecond or less.
 Count|   Total(ms)         | Avg(ms) | Artist
    5 |   38.49  1.0%    1% |    7.70 | 140673392785776 XAxis(56.264222222222216,427.88922222222226)
    5 |   38.42  1.0%    2% |    7.68 | 140673333479120 XAxis(456.26422222222214,427.88922222222226)
    5 |   38.23  1.0%    3% |    7.65 | 140673333199344 YAxis(56.264222222222216,427.88922222222226)
    5 |   37.81  1.0%    4% |    7.56 | 140673334146336 Legend
    5 |   35.99  0.9%    5% |    7.20 | 140673226497456 Legend
    5 |   35.96  0.9%    6% |    7.19 | 140673333711856 XAxis(56.264222222222216,27.889222222222227)
    5 |   35.44  0.9%    7% |    7.09 | 140673333928496 XAxis(456.26422222222214,27.889222222222227)
    5 |   35.39  0.9%    7% |    7.08 | 140673226654240 Legend
    5 |   35.16  0.9%    8% |    7.03 | 140673226664368 Legend
    5 |   32.69  0.8%    9% |    6.54 | 140673333481184 YAxis(456.26422222222214,427.88922222222226)
    5 |   32.36  0.8%   10% |    6.47 | 140673333930272 YAxis(456.26422222222214,27.889222222222227)
    5 |   31.71  0.8%   11% |    6.34 | 140673333713920 YAxis(56.264222222222216,27.889222222222227)
    5 |    5.85  0.1%   11% |    1.17 | 140673333207552 Text(0.5, 1.0, 'Draw Animated Incremental a 5')
    5 |    5.56  0.1%   11% |    1.11 | 140673333489488 Text(0.5, 1.0, 'Draw Animated Incremental b 5')
    5 |    5.52  0.1%   11% |    1.10 | 140673334134384 Text(0.5, 1.0, 'Draw Animated Incremental d 5')
    5 |    5.48  0.1%   11% |    1.10 | 140673333715840 Text(0.5, 1.0, 'Draw Animated Incremental c 5')
  400 |  347.82  8.8%   20% |    0.87 | 140673333207840 Annotation(0, 1, 'frame: 399')
  400 |  201.54  5.1%   25% |    0.50 | 140673333488144 Annotation(0, 1, 'frame: 399')
  400 |  198.71  5.0%   30% |    0.50 | 140673334134672 Annotation(0, 1, 'frame: 399')
  400 |  198.24  5.0%   35% |    0.50 | 140673226503024 Annotation(0, 1, 'frame: 399')
  400 |  188.18  4.8%   40% |    0.47 | 140673334145952 Annotation(0, 1, 'fps: 31.7')
  400 |  186.80  4.7%   45% |    0.47 | 140673334143840 Line2D(red)
  400 |  175.82  4.5%   49% |    0.44 | 140673226654000 Annotation(0, 1, 'fps: 31.7')
  400 |  175.17  4.4%   54% |    0.44 | 140673226497216 Annotation(0, 1, 'fps: 31.7')
  400 |  174.76  4.4%   58% |    0.44 | 140673226664128 Annotation(0, 1, 'fps: 31.7')
    5 |    1.93  0.0%   58% |    0.39 | 140673392785872 Spine
  400 |  125.32  3.2%   61% |    0.31 | 140673226494816 Line2D(red)
  400 |  124.27  3.1%   65% |    0.31 | 140673226660624 Line2D(red)
  400 |  122.08  3.1%   68% |    0.31 | 140673226504656 Line2D(red)
  400 |  112.09  2.8%   71% |    0.28 | 140673226495488 Line2D(blue)
  400 |  110.91  2.8%   73% |    0.28 | 140673226662400 Line2D(blue)
  400 |  109.54  2.8%   76% |    0.27 | 140673226505328 Line2D(blue)
  400 |  107.25  2.7%   79% |    0.27 | 140673226496160 Line2D(green)
  400 |  106.40  2.7%   82% |    0.27 | 140673226663072 Line2D(green)
  400 |  106.13  2.7%   84% |    0.27 | 140673334144512 Line2D(blue)
  400 |  105.18  2.7%   87% |    0.26 | 140673226506000 Line2D(green)
  400 |  102.99  2.6%   89% |    0.26 | 140673226496832 Line2D(brown)
  400 |  102.56  2.6%   92% |    0.26 | 140673226663744 Line2D(brown)
  400 |  102.37  2.6%   95% |    0.26 | 140673333707440 Line2D(brown)
  400 |  101.70  2.6%   97% |    0.25 | 140673334144896 Line2D(green)
  400 |   99.64  2.5%  100% |    0.25 | 140673334145568 Line2D(brown)
    5 |    1.07  0.0%  100% |    0.21 | 140673333479072 Spine
    5 |    1.02  0.0%  100% |    0.20 | 140673333711808 Spine
    5 |    1.00  0.0%  100% |    0.20 | 140673333928448 Spine
    5 |    0.59  0.0%  100% |    0.12 | 140673392786352 Spine
    5 |    0.57  0.0%  100% |    0.11 | 140673392786112 Spine
    5 |    0.50  0.0%  100% |    0.10 | 140673333479552 Spine
    5 |    0.50  0.0%  100% |    0.10 | 140673333928928 Spine
    5 |    0.49  0.0%  100% |    0.10 | 140673333712288 Spine
    5 |    0.48  0.0%  100% |    0.10 | 140673333712048 Spine
    5 |    0.48  0.0%  100% |    0.10 | 140673333479312 Spine
    5 |    0.48  0.0%  100% |    0.10 | 140673333928688 Spine
    5 |    0.44  0.0%  100% |    0.09 | 140673392786592 Spine
    5 |    0.38  0.0%  100% |    0.08 | 140673333712528 Spine
    5 |    0.38  0.0%  100% |    0.08 | 140673333479792 Spine
    5 |    0.37  0.0%  100% |    0.07 | 140673333929024 Spine